MTV: Catfish the TV Show
Redesigning On-Set Workflows, keeping TV Production Rolling for 50+ Episodes

Industry
Entertainment
Timeline
4 months
Year
2020
Team
Myself, Lead Digital Imaging Tech
Production Team of 15+ people
Post Production Team of 10+ people
Camera Team 5+ People
Overview
MTV: Catfish the TV show, A show Built on Authentic Storytelling
Background
MTV: Catfish the TV Show first started as a documentary
Project Overview
When I joined, NimbleBrain was pivoting from a Slack-only chatbot into a full SaaS platform. My role was to support stakeholders in reshaping their MVP for this new direction. At the time, early users struggled with a dense interface and had trouble completing core tasks independently.
Business Impact
Through redesigning key workflows and simplifying the interface, we improved usability and gave users confidence to set up and navigate the platform on their own. This reduced customer support load, sped up onboarding, and positioned NimbleBrain for growth beyond its Slack-based origins.
50+
New Episodes
6%
Remote Workflow is still used today
23%
Increased Task Completion
Challenge
Production wanted to keep filmign With the pandemic stopped filming, we figured out a way to imrpove
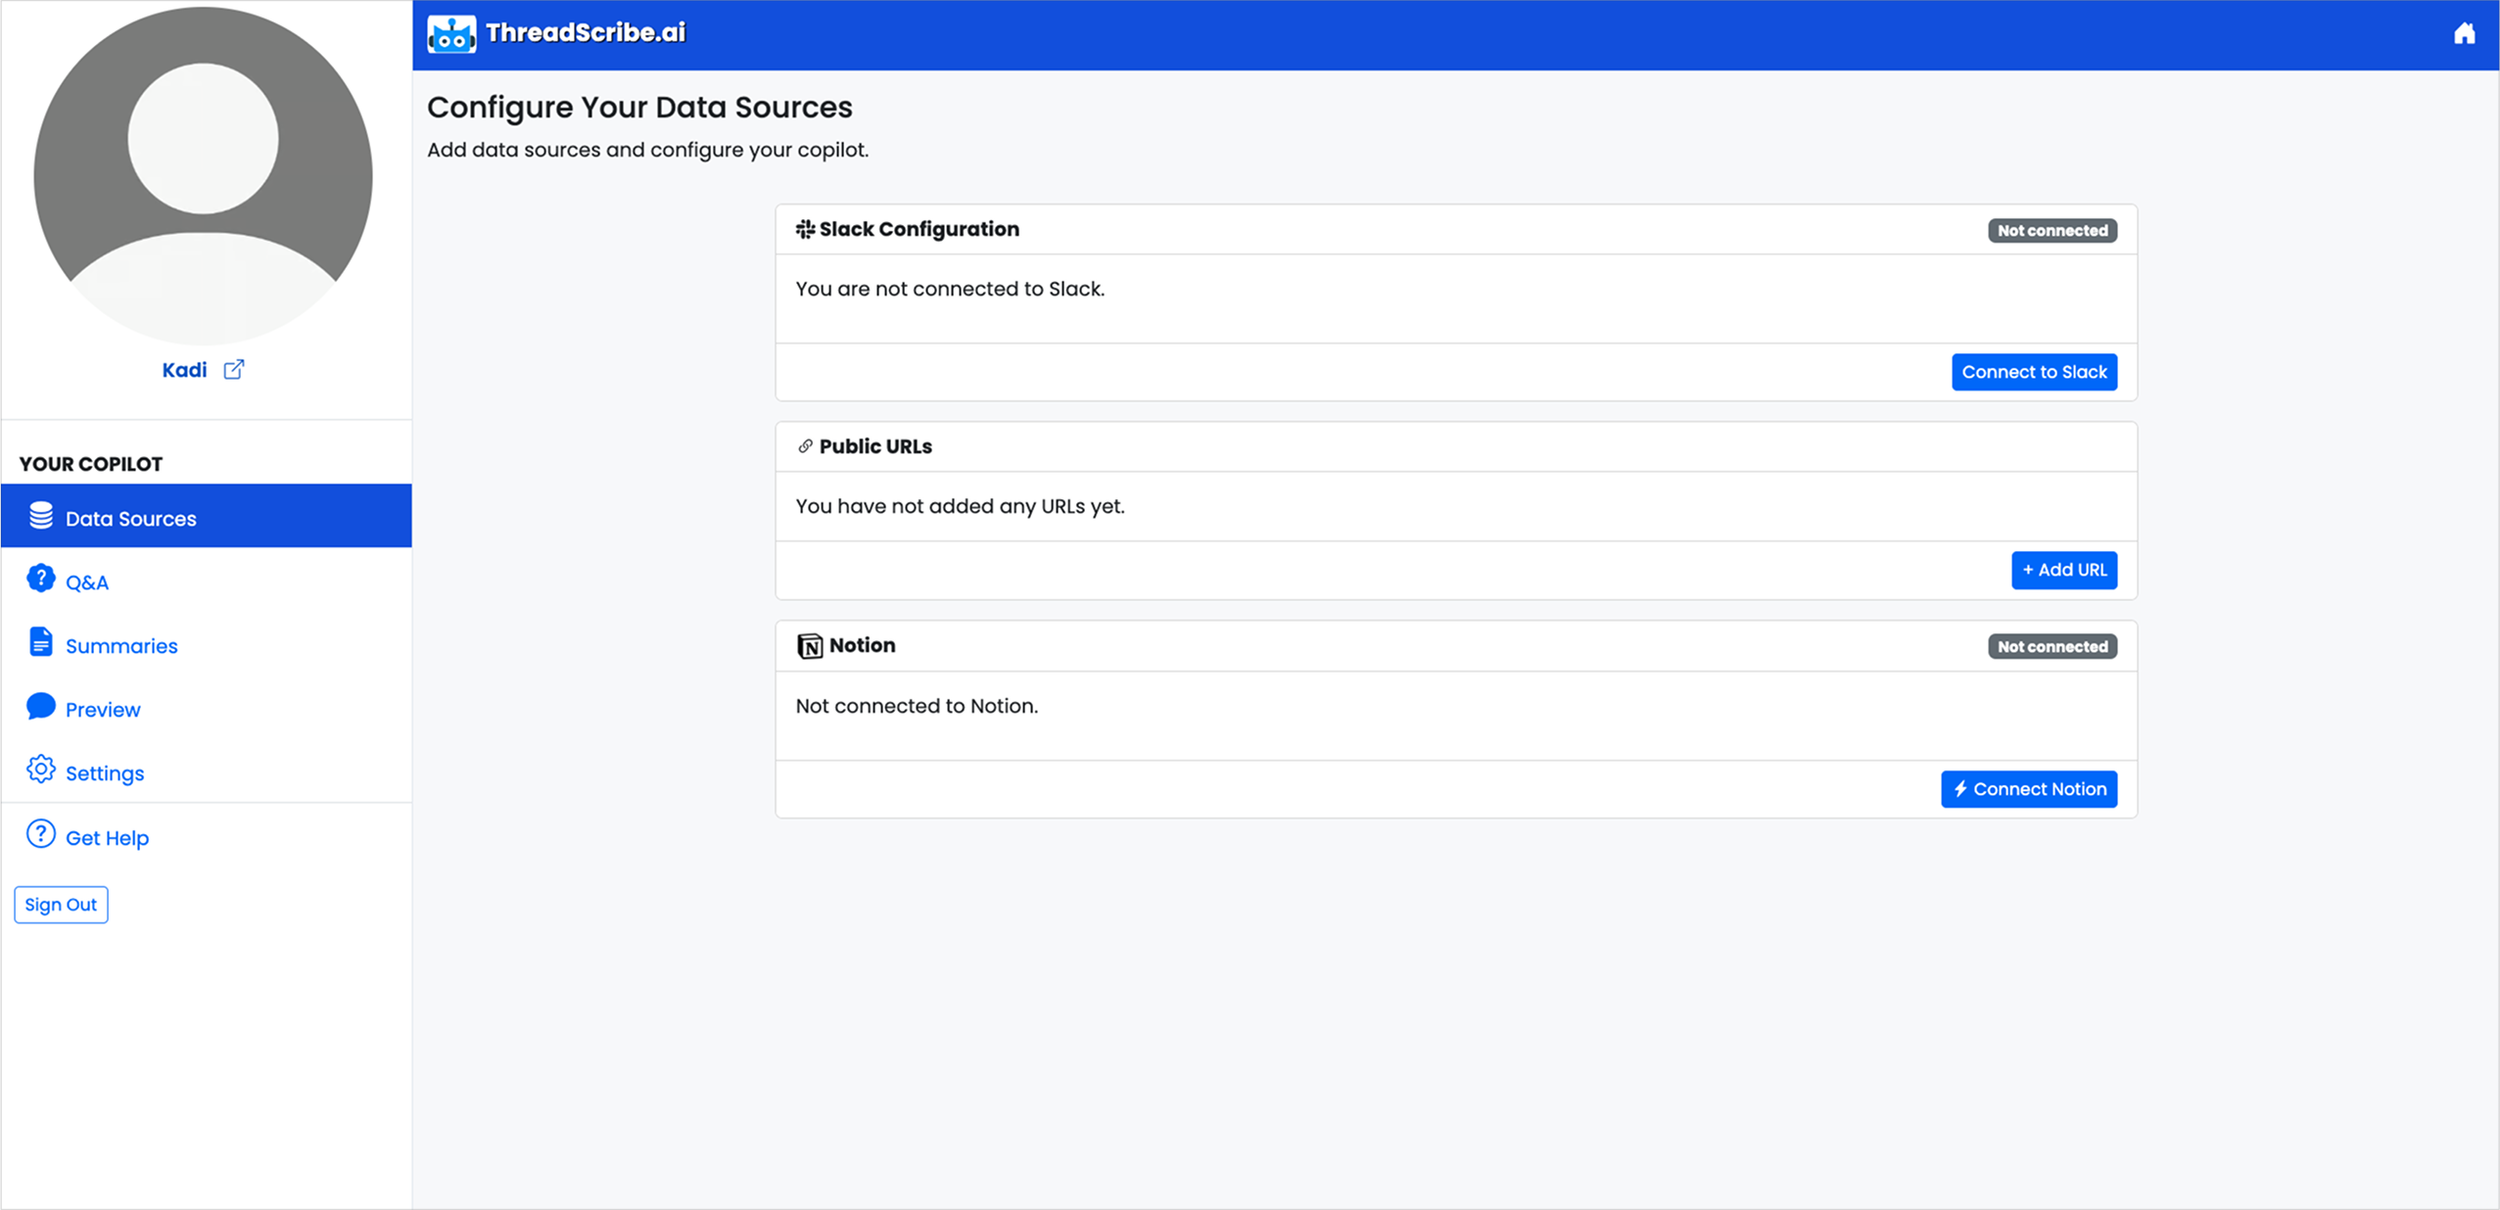
New users didn’t understand how to set up their dashboards. They kept asking for help, which made customer support tickets pile up.
“Where do I begin? What does Data sources mean? Do I have to connect all these platforms? “
Solution
We made Setup Simple
I led the redesign of the dashboard with clear steps and consistent design patterns. This lets new users set things up on their own instead of needing customer support.

Solution #1 - Clear System Feedback
We added real-time alerts and status messages so users could see right away if something wasn’t working and how to fix it.

Solution #2 - Consistent Design Pattern
When users connected tools like Google Drive or Airtable, the setup screens all looked different. I designed one clear, reusable pattern so every platform felt the same and was easier to use.

Solution #3 - Clear Copy
We changed confusing, technical messages into simple, easy-to-read language. This helped users understand what to do and feel more confident, especially people who aren’t very technical.

Design Process
Research
Users couldn’t set up the dashboard
Through heuristic evaluations and usability testing, we saw that users often blamed themselves when they struggled with onboarding. Many could start tasks but weren’t sure how to finish, which led them to reach out to customer support.
Key Insight: Users couldn’t complete tasks independently and relied on support for help.
“When I first onboarded, I had to send support a long list of questions. ”
“Now that I have everything connected, what do I do next?”
Ideation
Designing for a complex system
Users didn’t need “more UI”—they needed clarity. I mapped how the system worked and defined how it should communicate with users: how to connect, what’s happening, how to spot and fix errors, why sources differ, and which platforms really need connecting.
Key user questions:
How do I connect external APIs?
What’s happening behind the scenes?
How do I know if something broke?
What should I do when I see an error?
Why does each source look and behave differently?
Do I need to connect all platforms, even ones I don’t use?

To answer these questions, I mapped out the system’s flows to uncover where users got lost and how errors were handled.
Design
Exploring design patterns that scale
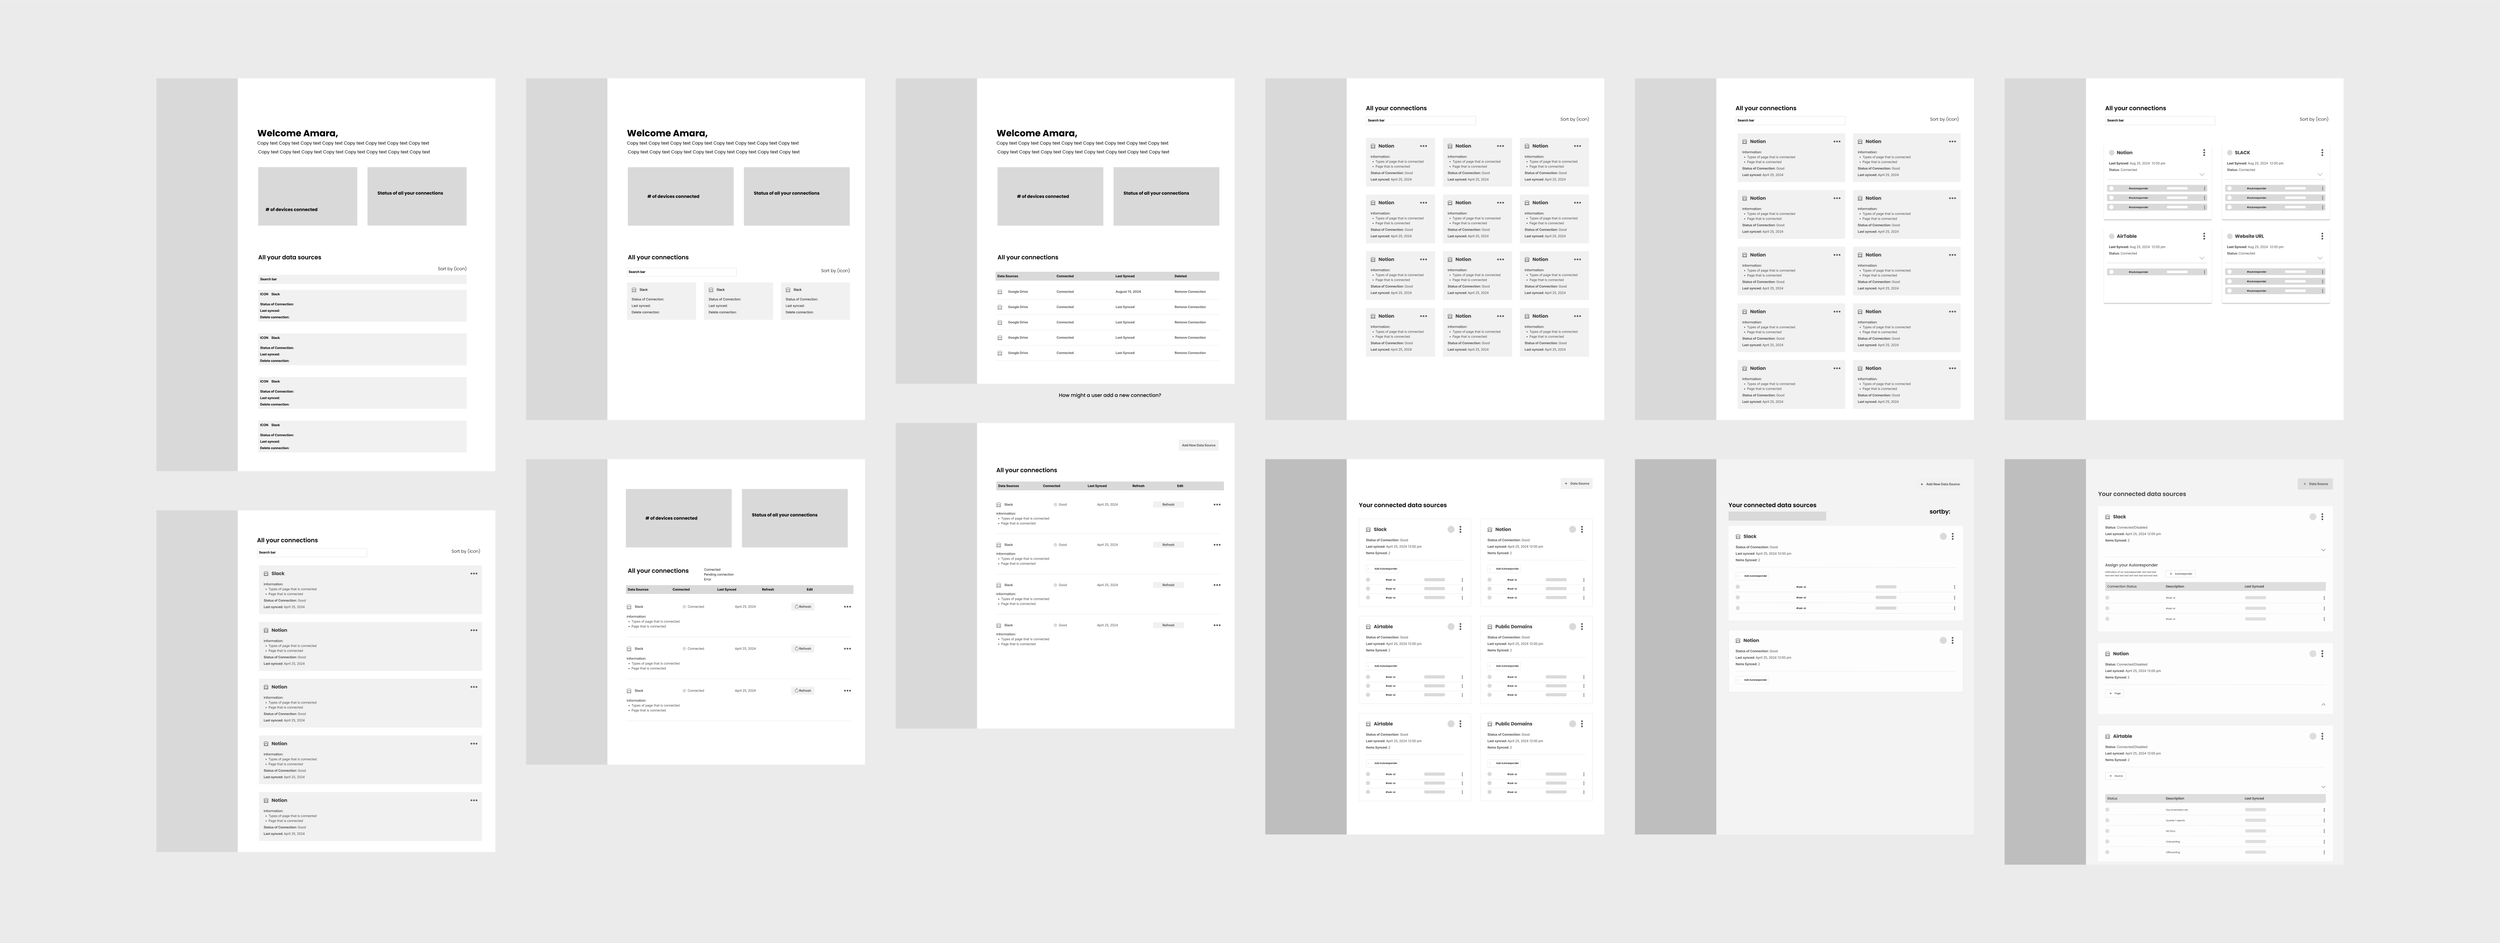
To keep things clear and easy to scale, we tested different flows using low- and mid-fidelity wireframes.
Low-fi: Focused on mapping key tasks like connecting, managing, and re-syncing data sources.
Mid-fi: Refined hierarchy, microcopy, and UI priorities (syncing, alerts, edge cases).
Patterns explored:
Step-by-step setup flows
Progressive disclosure (showing info only when needed)
Cards and tables for organizing data
On-screen instructions and alerts for feedback
Final approach: A hybrid pattern using progressive disclosure and Bootstrap components—scalable, clear, and easy to maintain.
Key Design Decisions
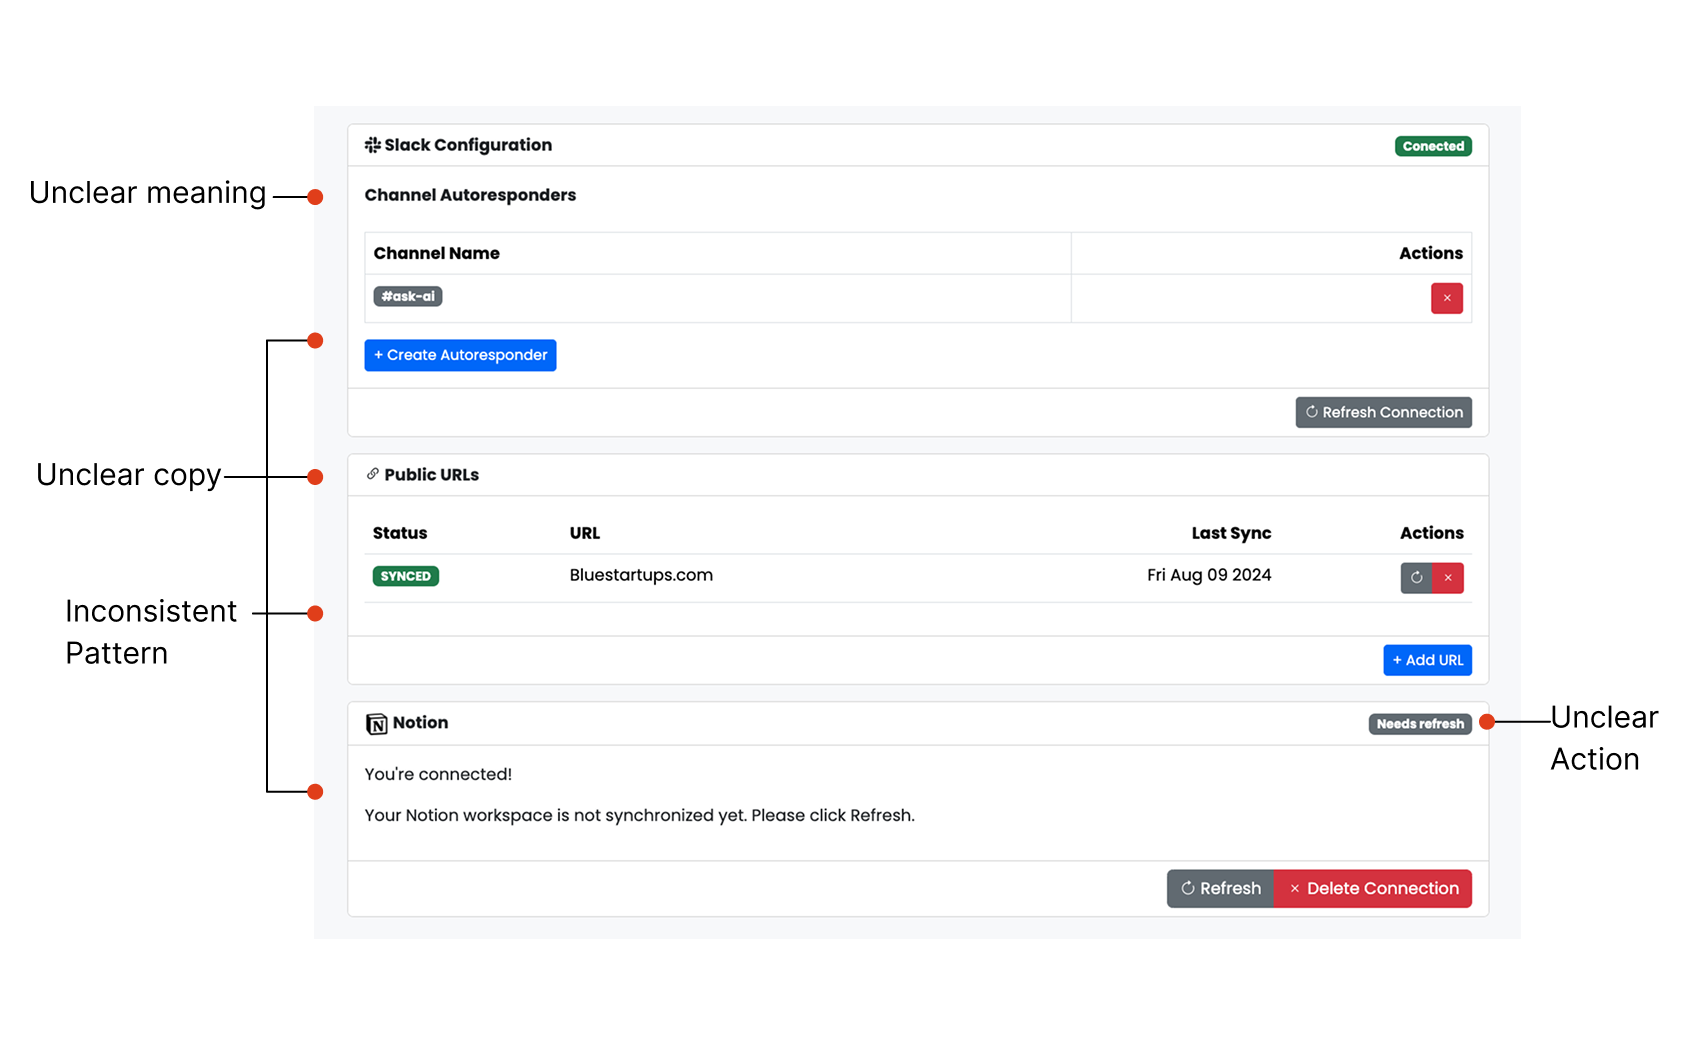
Before
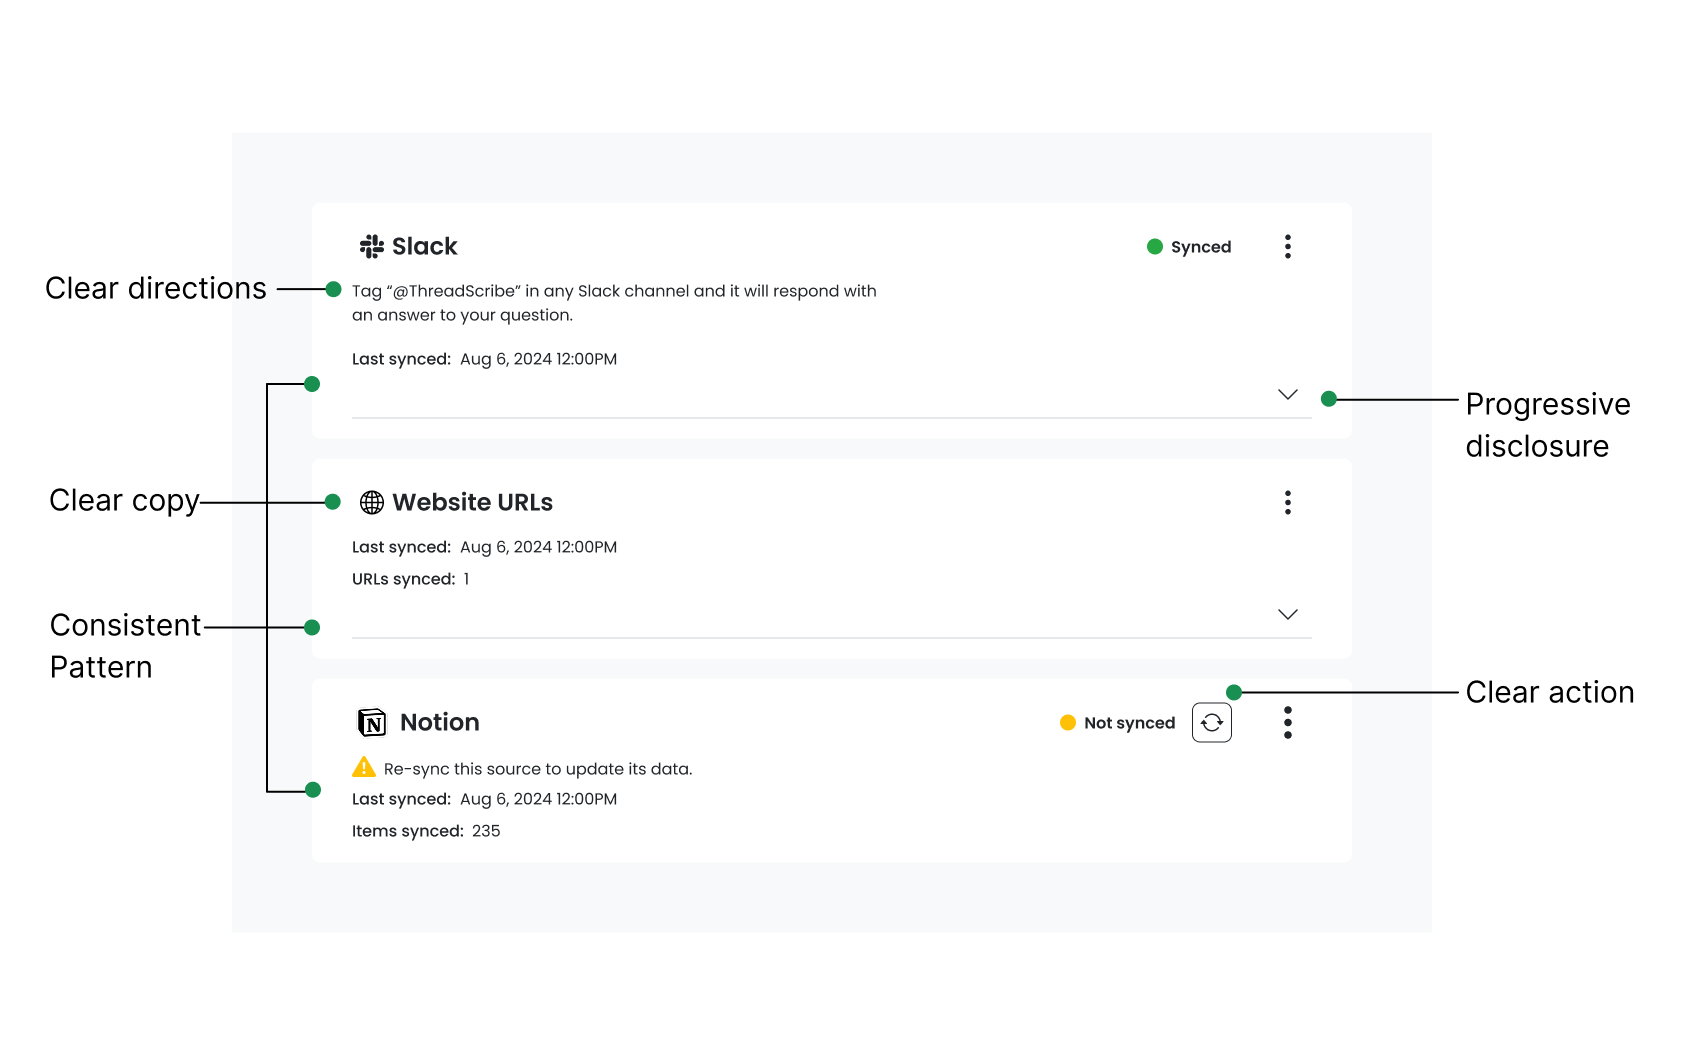
After
Business Impact
Measuring Success – Did It Work?
We validated the redesign with another round of usability testing using the same group of users. The results showed clear improvements: the redesign made key tasks easier, boosted user confidence, and reduced the need for support.
50%
Increase in Task Completion
7 to 1
Reduced Help Request
62%
Increase in User Satisfaction
Reflections
Adaptability in a Startup Setting
This project taught me how to make complex systems feel simple. API limits meant I couldn’t change how the system worked, but I could improve how it communicated—through clearer feedback, better copy, and consistent design patterns.
I also strengthened my collaboration skills, leading weekly check-ins and working closely with engineers to strike a balance between usability and feasibility. The big takeaway: great design isn’t just about looks—it’s about turning complexity into clarity.